Thanks so much everyone for stopping by!

Thanks so much everyone for stopping by!
Posted in
Author Scott Chamberlain09 Jun 2011
A new paper out in Ecology by Xiao and colleagues (in press, here) compares the use of log-transformation to non-linear regression for analyzing power-laws.
They suggest that the error distribution should determine which method performs better. When your errors are additive, homoscedastic, and normally distributed, they propose using non-linear regression. When errors are multiplicative, heteroscedastic, and lognormally distributed, they suggest using linear regression on log-transformed data. The assumptions about these two methods are different, so cannot be correct for a single dataset.
They will provide their R code for their methods once they are up on Ecological Archives (they weren't up there by the time of this post).
Posted in Methods Papers Statistics R
Author Scott Chamberlain07 Jun 2011
I am writing a set of functions to search ITIS for taxonomic information (more databases to come) and functions to fetch plant phylogenetic trees from Phylomatic. Code at github.
Also, see the examples in the demos folder on the Github site above.
Posted in Phylogenetics taxize R ITIS
Author Scott Chamberlain03 Jun 2011
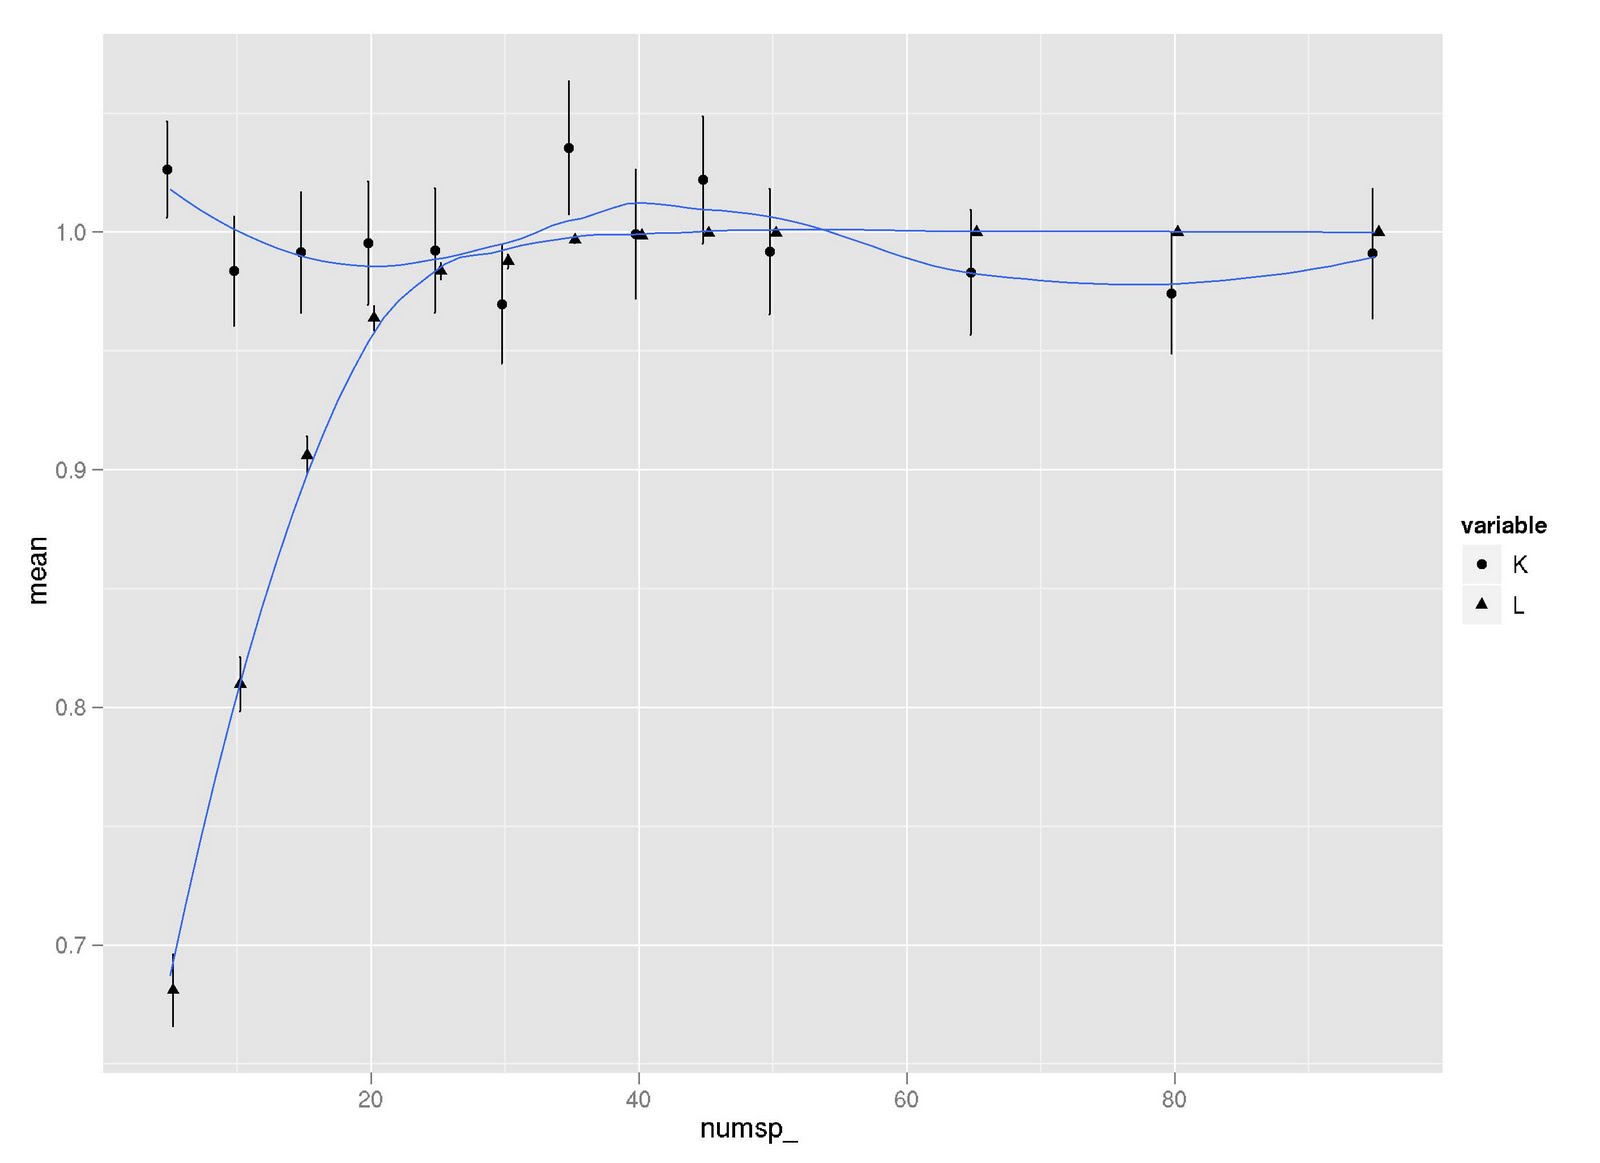
I did a little simulation to examine how K and lambda vary in response to tree size (and how they compare to each other on the same simulated trees). I use Liam Revell's functions fastBM to generate traits, and phylosig to measure phylogenetic signal.
Two observations:
First, it seems that lambda is more sensitive than K to tree size, but then lambda levels out at about 40 species, whereas K continues to vary around a mean of 1.
Second, K is more variable than lambda at all levels of tree size (compare standard error bars).
Does this make sense to those smart folks out there?
Posted in ggplot2 ape Phylogenetics
Author Scott Chamberlain18 May 2011
UPDATE: Greg jordan has a much more elegant way of plotting trees with ggplot2. See his links in the comments below.
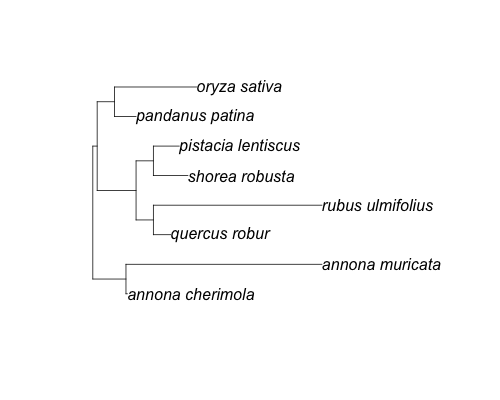
I wrote a simple function for plotting a phylogeny in ggplot2. However, it only handles a 3 species tree right now, as I haven't figured out how to generalize the approach to N species.
Any ideas on how to improve this?
Posted in ggplot2 Phylogenetics R
Author Scott Chamberlain17 May 2011