So OpenCPU is pretty awesome. You can run R in a browser using URL calls with an alphanumeric code (e.g., x3e50ee0780) defining a stored function, and any arguments you pass to it.
Go here to store a function. And you can output lots of different types of things: png, pdf, json, etc - see here.
Here's a function I created:
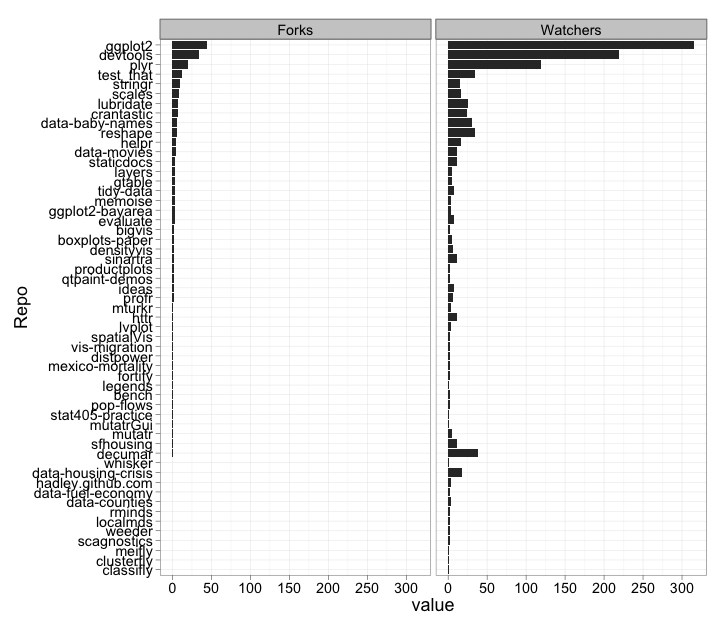
It makes a [ggplot2][] graphic of your watchers and forks on each repo (up to 100 repos), sorted by descending number of forks/watchers.
Here's an example from the function. Paste the following in to your browser and you should get the below figure.
[http://beta.opencpu.org/R/call/opencpu.demo/gitstats/png][]

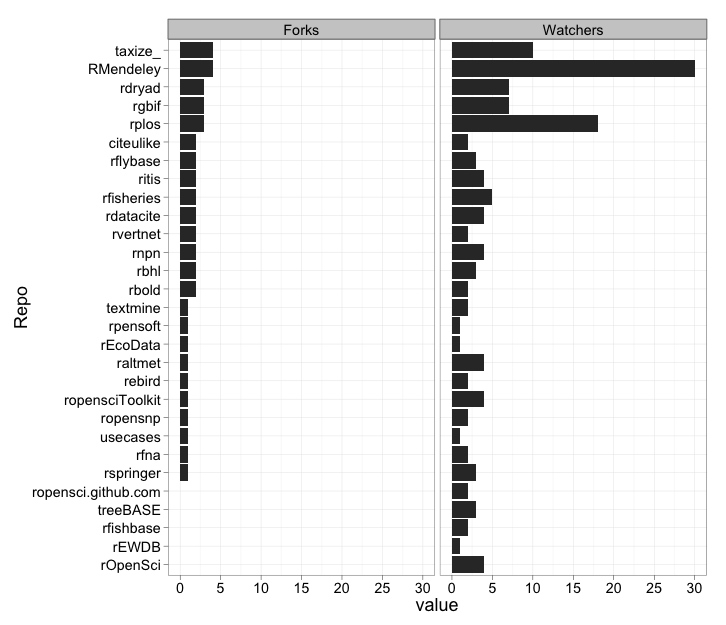
And you can specify user or organization name using arguments in the URL
[http://beta.opencpu.org/R/call/opencpu.demo/gitstats/png?type='org'&id='ropensci'][]

Sweet. Have fun.


