# Analyses of Conditionality Data set of all variables, except for latitude, etc.
setwd("/Mac/R_stuff/Blog_etc/EvolutionTeaching/") # Set working directory
library(ggplot2)

# read in data, and prepare new columns
survey <- read.csv("berkmandata.csv")
str(survey) # (I do realize that survey is a data object in the MASS package)

# Assign actual hours to survey answers
ecol <- gsub(1, 0, survey$q1b)
ecol <- gsub(2, 1.5, ecol)
ecol <- gsub(3, 4, ecol)
ecol <- gsub(4, 8, ecol)
ecol <- gsub(5, 13, ecol)
ecol <- gsub(6, 18, ecol)
ecol <- gsub(7, 20, ecol)

evol <- gsub(1, 0, survey$q1d)
evol <- gsub(2, 1.5, evol)
evol <- gsub(3, 4, evol)
evol <- gsub(4, 8, evol)
evol <- gsub(5, 13, evol)
evol <- gsub(6, 18, evol)
evol <- gsub(7, 20, evol)

survey$ecol <- as.numeric(ecol)
survey$evol <- as.numeric(evol)

# ddply it
survey_sum <- ddply(survey, .(st_posta), summarise,
 mean_ecol_hrs = mean(ecol, na.rm=T),
 mean_evol_hrs = mean(evol, na.rm=T),
 se_ecol_hrs = sd(ecol, na.rm=T)/sqrt(length(ecol)),
 se_evol_hrs = sd(evol, na.rm=T)/sqrt(length(evol)),
 num_teachers = length(st_posta)
)

# plotting
limits_ecol <- aes(ymax = mean_ecol_hrs + se_ecol_hrs, ymin = mean_ecol_hrs - se_ecol_hrs)
limits_evol <- aes(ymax = mean_evol_hrs + se_evol_hrs, ymin = mean_evol_hrs - se_evol_hrs)

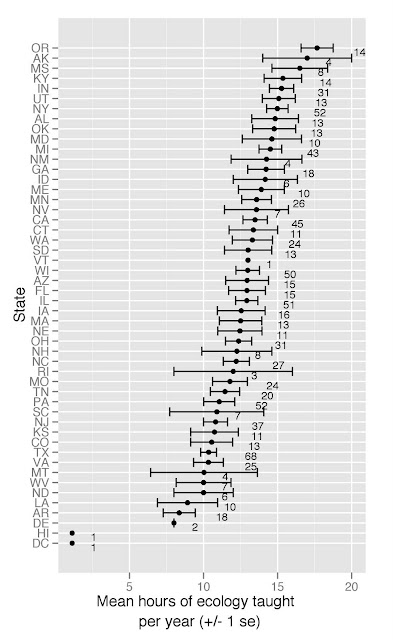
ggplot(survey_sum, aes(x = reorder(st_posta, mean_ecol_hrs), y = mean_ecol_hrs)) +
 geom_point() +
 geom_errorbar(limits_ecol) +
 geom_text(aes(label = num_teachers), vjust = 1, hjust = -3, size = 3) +
 coord_flip() +
 labs(x = "State", y = "Mean hours of ecology taught \n per year (+/- 1 se)")
####SMALL NUMBERS BY BARS ARE NUMBER OF TEACHERS THAT RESPONDED TO THE SURVEY

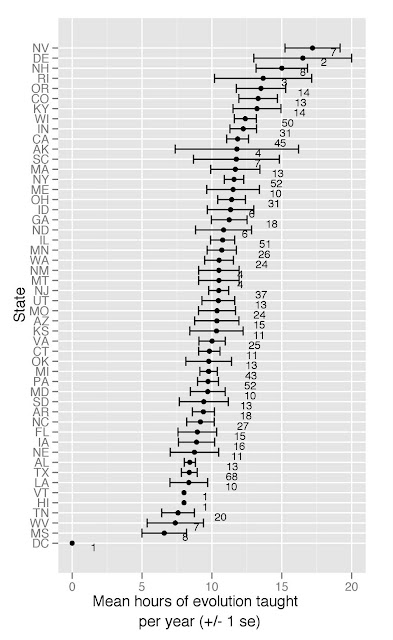
ggplot(survey_sum, aes(x = reorder(st_posta, mean_evol_hrs), y = mean_evol_hrs)) +
 geom_point() +
 geom_errorbar(limits_evol) +
 geom_text(aes(label = num_teachers), vjust = 1, hjust = -3, size = 3) +
 coord_flip() +
 labs(x = "State", y = "Mean hours of evolution taught \n per year (+/- 1 se)")
 ####SMALL NUMBERS BY BARS ARE NUMBER OF TEACHERS THAT RESPONDED TO THE SURVEY


# map
try_require("maps")
states <- map_data("state")
statenames <- read.csv("/Mac/R_stuff/Code/states_abbreviations.csv")
survey_sum <- merge(survey_sum, statenames, by.x = "st_posta", by.y = "state_abbrev")
survey_sum_map <- merge(states, survey_sum, by.x = "region", by.y = "state")
survey_sum_map <- survey_sum_map[order(survey_sum_map$order), ]

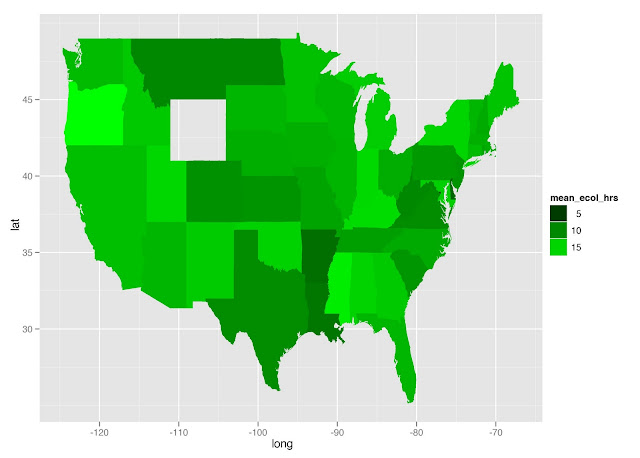
qplot(long, lat, data = survey_sum_map, group = group, fill = mean_ecol_hrs, geom = "polygon") + scale_fill_gradient(low="black", high="green")

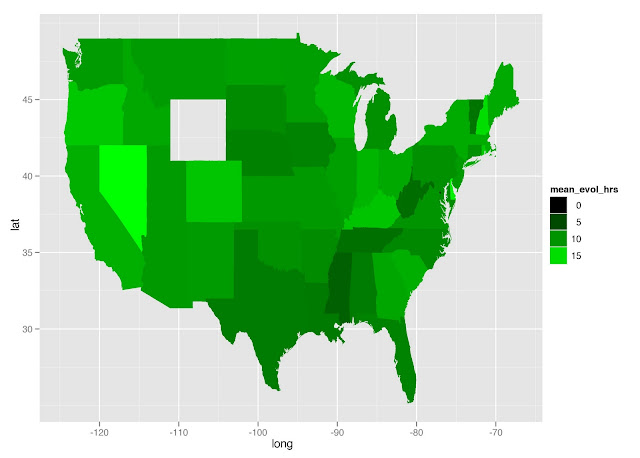
qplot(long, lat, data = survey_sum_map, group = group, fill = mean_evol_hrs, geom = "polygon") + scale_fill_gradient(low="black", high="green")


